
The Theory
At the very core of Austrian Business Cycle Theory (ABCT) lies the central tenant that the artificial manipulation of the interest rate by central planners serves as the root cause of the perpetual boom-bust cycles which have come to dominate modern-day economic society. As the interest rate is held below what would naturally be dictated by a free and unencumbered market, the money supply is continuously expanded through the modern-day fractional reserve banking system and the new funds subsequently spent by the first receivers of this new money into the broad economy.
The infusion of funds at record-low interest rates thus begins a cascade of errors by businesses and investors everywhere, as they are all at once misled into the pursuit of various projects which would be uneconomical at a higher interest rates. As businesses seeking to make investments into new projects begin to qualify for low-interest rate loans and begin spending this newly-created money in an effort to increase their productive capacity, they correspondingly bid up the prices of capital goods such as raw materials, commodities, construction equipment, and machinery. This subsequently increases the revenue of capital good suppliers which filters through to the everyday worker in the form of higher take-home wages which in turn is spent on various consumer goods and products throughout the economy.
Speculators too, now able to easily borrow at record-low rates, find it suddenly profitable to begin speculating in various financial markets and real estate, thus bidding up the prices of stocks and housing as mainstream pundits rush to declare the beginning of a new bull market in equities and real estate. Flush with their newfound wealth from rising asset prices, these same speculators now begin to spend the proceeds of their investment gains on additional consumer products and luxury items, bidding up prices further still while simultaneously increasing revenue for the various producers of these goods and services. But the increase in profits which has subsequently filtered through to wages now begins to draw labor to these industries and away from those businesses so far untouched by the inflation. As a consequence, a widespread labor shortage begins to develop and firms throughout the economy find that they must now begin paying higher wages merely to retain existing staff.
It is in this manner then that an increase in the money supply driven by the artificial lowering of the interest rate sets off what appears to be a general economic boom. As businesses expand along with employment, wages, and asset values, the virtuous cycle of economic growth advances unabated. But the boom is only a period of mal-investment as spending occurs on an unprecedented scale, utilizing scarce physical resources in the economy on projects that are inefficient and gross misallocations of capital made possible only be artificially low interest rates.
It can be seen at once that the boom can therefore only continue so long as the money supply is continuously expanded. For any reduction in the rate of money supply growth will serve to reduce end-user demand to those industries which have started new projects and investments based on erroneous assumptions of increasing consumer spending patterns. Asset prices will similarly begin to cascade lower as leveraged speculators are forced to abandon the trough of easy money due to lower money-inflows into speculative assets. Businesses will be forced to shrink or go out of business altogether, subsequently impacting employee wages and increasing unemployment throughout the economy. The economic boom will as a consequence transform into a widespread economic bust as the curtailment of the money supply begins to have a depressing impact on the suppliers and ancillary businesses of the bubble industries currently propped up by a sea of easy money.
Yet the transformation from boom to bust can ultimately be seen as an inevitable result of the initial lowering of the interest rate, for the money supply growth is merely increasing the quantity of paper currency in circulation rather than representing the end result of past production. The creation of money “out of thin air” does nothing to increase the amount of real goods and services in the economy, resulting in a process of “too much money chasing too few goods” as prices subsequently begin to rise throughout the economy at an unacceptable rate. It is this increase in general prices which ultimately causes central bankers to raise interest rates and reduce the growth rate of the money supply to satisfy their mandate of “price stability”, thus triggering an economic bust as the mal-investment is at last exposed as an illusory mirage of cheap money masquerading as legitimate savings and tangible real wealth.
But governments and central bankers do not accept that the bust is merely a necessary precondition required to correct the unsustainable misallocation of capital committed during the bubble years of the so-called boom. Rather than allowing the structure of the economy to adjust and enabling businesses and consumers to reallocate the capital stock to those best able to employ it, they naively attempt to slash interest rates once again in order to increase the money supply and foster the next false economic boom born out of erroneous market signals based on cheap and easy money. The misallocation of capital from prior years is thus never fully liquidated, the productive structure of the economy fails to fully adjust to its optimal state, and the economy is perpetually weakened as society moves repeatedly from one economic boom-bust cycle to the next.
As the economy subsequently grows weaker and weaker over time with the cumulative mal-investment of each subsequent boom, it begins to take increasingly larger injections of new money to achieve smaller incremental increases in economic growth. By similar logic, the accumulated structural rot of the boom years also results in smaller and smaller reductions in money supply growth being required to expose the underlying weaknesses in the general economy and subsequently trigger a widespread economic bust (for an easy-to-understand example of this destructive process in action, see the article Inflation, the Disease of Money). The boom-bust cycle instigated by central banks, therefore, does far more damage than merely accentuating the volatility experienced by consumers and businesses as part of the general business cycle. Instead, the constant shift from boom to bust back to boom will over time erode the productive means of society, increasing economic vulnerability to unforeseen tail-risk and other exogenous financial shocks while at the same time impeding both the competitiveness and sustainability of domestic industry within the context of a global economy.
The Evidence
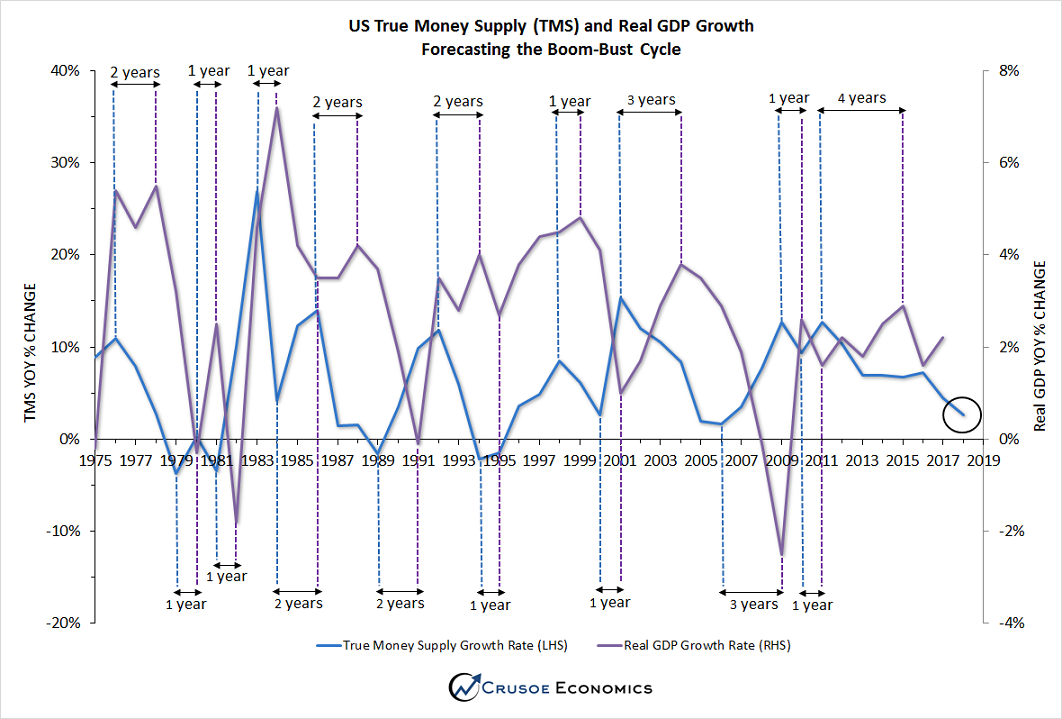
The real-world evidence of Austrian Business Cycle Theory in action is clearly visible when one examines the long history of money supply growth in relation to the corresponding growth in real GPD. Because we know that unsustainable economic growth is driven by an increase in the growth rate of the money supply and the subsequent downturn is, in turn, driven by its reduction, we would expect to see peaks in GDP growth be preceded by peaks in money supply growth and troughs in GDP growth be preceded by troughs in money supply growth. In fact, as the graph below illustrates, this is exactly what we see*.

It is important to note that the above graph uses the Austrian True Money Supply (TMS) metric rather than M1 or M2, as TMS is a far superior metric more correctly accounting for the actual spendable money in circulation within the economy. For a detailed explanation on why TMS is thought to be a more accurate measurement of money than the widely followed M1 or M2, see the article Follow the Money (Supply). As is clearly shown in the graph above, the money supply serves as a leading indicator for the economy, with peaks in TMS occurring anywhere from 1 to 4 years prior to peaks in GDP, and troughs in TMS occurring anywhere from 1 to 3 years prior to troughs in GDP. This is precisely what one would expect to see according to ABCT, as economic booms and busts are in fact simple artifacts of overall trend changes in the rate of monetary expansion.
It should also be no great surprise that we observe a delayed relationship between extreme highs in TMS relative to extreme highs in GDP, as inflation serves to distort relative prices, asset values, employment, and take-home wages in non-uniform ways. The artificially low interest rates and the corresponding increase in the money supply causes prices to rise first for the most liquid speculative assets, spreading more slowly to the real economy as businesses are somewhat slower to expand in response to the sudden increase in new liquidity bidding up the prices of their goods and services. By similar reasoning, a sudden contraction in the money supply does not lead to an immediate liquidation of all economic mal-investment and an instantaneous spike lower in GDP, for while projects that are discovered to be uneconomical will tend to be quickly liquidated at a loss and the workforce correspondingly reduced, businesses in general will tend to consider complete capitulation and bankruptcy only as a last resort, for their livelihood depends on it.
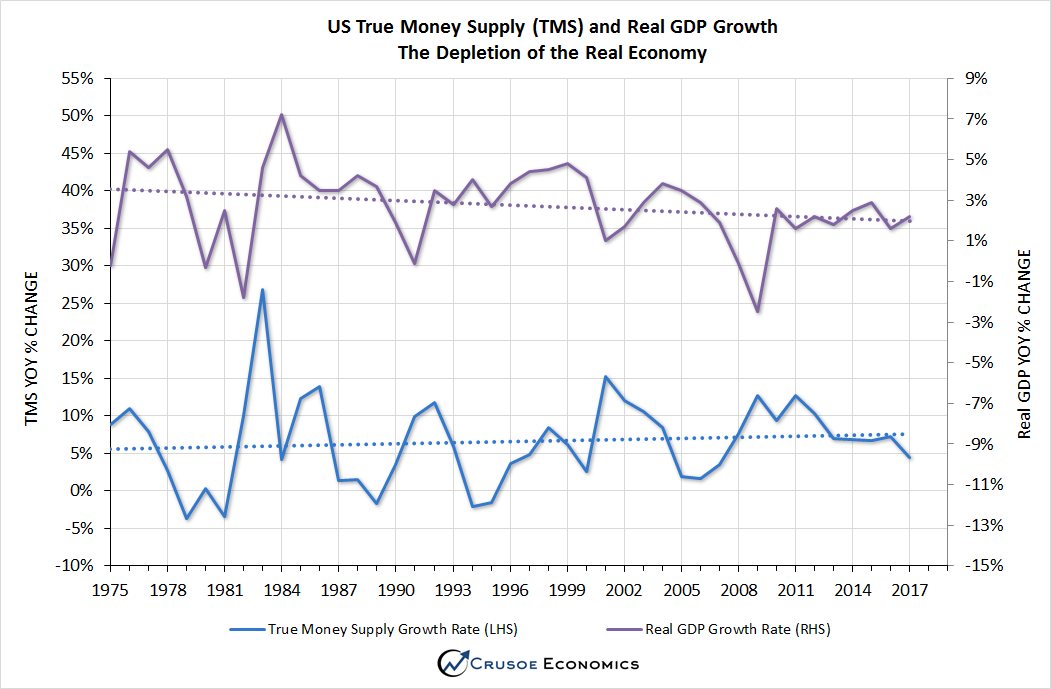
What is perhaps not as clearly visible on the chart above is that economic growth has over the decades been experiencing diminishing returns from each successive round of money-pumping. This is illustrated by the fact that GDP growth has been trending downwards for decades while money supply expansion has conversely been trending upwards over this same time period. This relationship is hopefully made more obvious in the chart below*, displaying more clearly the trend between TMS and GDP growth since 1975:

Once again, the chart above serves to corroborate the conclusion of ABCT in that each round of monetary stimulus provides less and less of a boost to the real economy due to the unwillingness of government to allow the cumulative capital misallocation of prior years to be fully liquidated. The bust is a necessary period during which those projects that were undertaken in error are abandoned and whatever capital has not been wasted in these erroneous endeavors is freed up for other uses. It is a period during which savers rebuild the economy’s pool of capital to fund future investments, and workers transition from the industries of the bubble economy to more sustainable jobs at lower wages.
The critical point here is that money and savings are not one and the same thing. Savings comes from past production, which represents the store of real goods and services in the economy that currently exists to fund future investments. This is capital. It represents the commodities that have been dug out of the ground, the machinery that sits idle, and the finished material available for the construction of factories and housing. Money that is created out of thin air has no corresponding backing of real physical goods, but the spending of this money on consumption serves to remove goods from the economy without serving to put anything back in its place. This results in the net depletion of the pool of capital available for future investment and as a consequence stifles the productive potential of society. In a similar manner, the various projects that are exposed as mal-investments during the bust years ultimately destroy existing stores of capital once the projects are at last abandoned, depleting yet again the capital base and hindering future increases in productivity. Finally, the rock-bottom interest rates of the boom years serves only to punish savers and erode the pool of available capital as society ceased to save altogether, choosing instead to borrow from an endless sea of money for the purpose of speculation and ultimately consumption.
The net effect of the boom-bust cycle is therefore ultimately to diminish the pool of available capital within the economy that can be used to fund future increases in productive investment, which is the reason why successive rounds of monetary stimulus have so far failed to increase GDP to quite the same levels as it has in the past. All of this is consistent with the Austrian theory of the business cycle and explains why economic growth has proved to be fleeting since the 2008 Great Financial Crisis despite unprecedented amounts of monetary stimulus. As is displayed clearly in the first chart in this article, the TMS growth rate has recently reached dangerously low levels which has in the past been indicative of an ensuing economic bust. If we assume that the cycle low for TMS occurred in 2018, then the next corresponding cycle low in the economy should occur anywhere from 1 to 3 years later, placing the bottom for the next trough in GDP growth somewhere between 2019 and 2021. This of course does not mean that visible weakness in the economy will not begin to manifest itself long before this point, only that this weakness will reach its cycle extreme somewhere in this general timeframe.
Central planners will almost assuredly address this collapse with new injections of money in order to “fight” the recession or engineer a “soft landing” as they are almost always prone to do. However, given the underlying weakness in the productive structure of the economy as a result of all the prior mal-investment and subsequent capital depletion, it is likely that the ensuing economic recovery will once again fall far short of the estimates of mainstream Keynesian economists, although not one in a hundred will likely understand why.
(*) The charts in this article are inspired by the fine work of Jeffrey Peshut over at RealForecasts.com. Jeffrey produces his charts based on True Money Supply metrics supplied by Michael Pollaro, while I have independently calculated the True Money Supply from publicly available Federal Reserve data.