
Canadians investors often lament the lack of sufficient sector diversification in the TSX given its heavy weightings towards both financials and resource extraction. While this is obviously true, it’s interesting to take a historical look at how sector weightings have changed over time in order to better see the structural shifts that have taken place in the Canadian equity landscape over the last several decades. Is the TSX heavily overweight a few specific sectors? Absolutely. Did things also used to be whole lot worse? You bet.
Courtesy of Blackrock, we’ve been able to extract monthly constituent membership data for the TSX back to 2006 along with each holding’s market weighting and sector category (technically, we use the holdings of XIC as a proxy for the TSX). We’ve aggregated the data to show changes in sector weightings for the TSX back to 2006. Data is calculated monthly and is shown below.
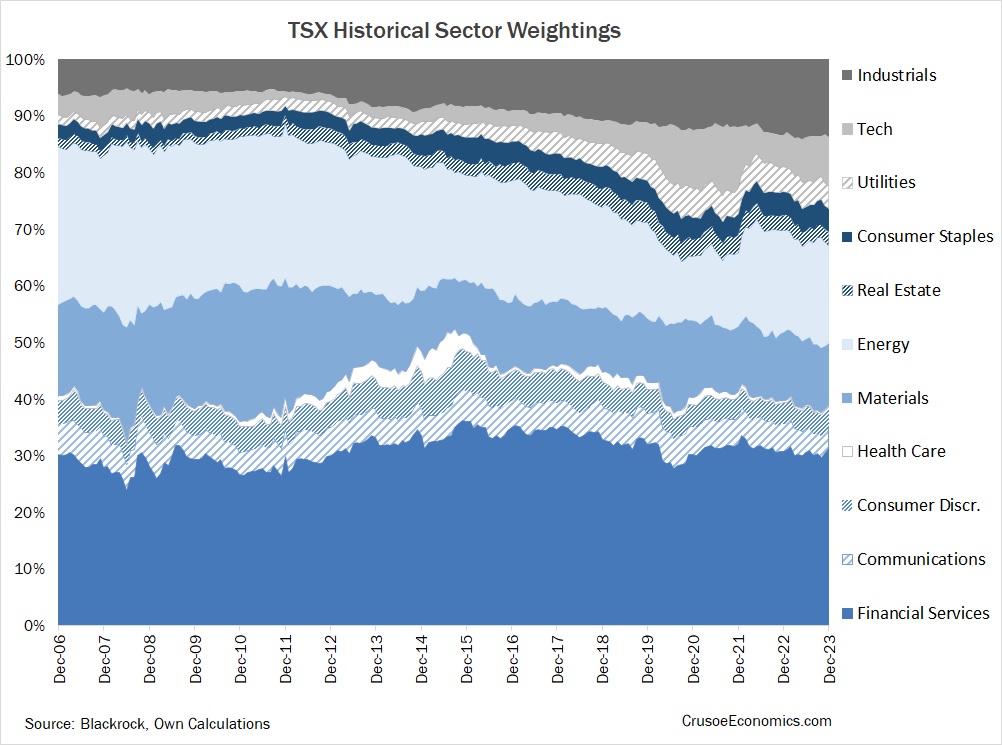
As every Canadian investor is well aware, there are only 3 constants in life: death, taxes, and the hegemony of the Canadian big 5 banks. We can see from the graph above that the financial sector in Canada not only dominates the landscape today, but has handily dominated the investing landscape over the last 17 years. Sure, there’s been some ebb and flow over the entire data set, but those periods have been fairly short lived. The financial sector was approximately 30% of the entire TSX at the end of 2006 and ends 2023 at roughly 31% – just a stone throw away. Of course, the financial sector wasn’t the only outsized sector in 2006. The energy sector ended 2006 at a 28% weighting of the TSX while materials constituted approximately 16%. Combined they came to almost 45% of the entire market. Between financials, energy, and materials, a full 75% of the index was split between just 3 sectors. So yes, you could definitely say that the TSX had a huge concentration problem in 2006.
If you play out the tape, however, we can see that the energy and material sectors have been gradually shrinking over the last 17 years, with energy moving from 28% of the TSX in 2006 to 17% in 2023 and materials moving from 16% in 2006 to 11% today. Combined, the energy and materials sectors have been reduced from a 45% weighting of the index to “just” 28% at the end of 2023. Obviously this is still extremely high from the perspective of investment diversification, but a 17% reduction in “overweightiness” is still a meaningful improvement that we should celebrate, not scoff at.
Of course, for every percentage point of weighting lost by one sector in the TSX, another sector is going to have a corresponding increase in weighting. Cumulatively, we can see that the beneficiaries of the shift have been the industrial, tech, utility, consumer staple, and real estate sectors. Visually in the graph above, you can see the top 5 sectors expanding in width from left to right while the energy and material sectors correspondingly shrink by a similar amount. The increase in weightings for each of these 5 sectors are as follows:
- Industrials: +7.38%
- Tech: +4.25%
- Utilities: +2.53%
- Consumer Staples: +1.76%
- Real Estate: +0.99%
Combined, these 5 sectors have increased by approximately +17% of the TSX’s total weighting, exactly offsetting the -17% reduction in the energy and materials sectors. Taken together, these 5 sectors have gone from a 15.4% weighting in 2006 to a 33% weighting in 2023. It’s a significant structural shift away from the material and energy sectors which has been led by the growth in the industrial and tech sectors.
Now, there’s obviously going to be some caveats regarding the above shift towards greater diversification. For example, while the tech sector has grown significantly over the years, Shopify is almost half of the entire sector. If Shopify were to go to zero tomorrow, the tech sector would be quickly cut in half. And while growth in the industrial sector has been more broad based, two companies (CP and CNR) still constitute almost half the entire sector, meaning that a negative shock to the railway industry would have significant negative repercussions on the overall industrial sector.
Truthfully, this exercise would have been far more interesting if we could have extended the data set back further than 2006, but even this limited data series taken from Blackrock shows us that, visually, the TSX has grown significantly more diverse over the last 17 years. Is it going to be enough for investors to forgo international diversification? Definitely not, but at the very least it should make the Canadian component of your portfolio a good deal less volatile.