
When it comes to investing one’s irreplaceable life savings, sometimes it’s not what you make that’s important, but what you keep. Much of the popular literature today tends to focus on the quest for risk-adjusted returns, but for many people the objective isn’t so much growing their money as it is safeguarding their existing capital from losses. Said another way, there are a lot of people who aren’t necessarily looking for a “get rich portfolio” – what they’re really just looking for is a “stay rich portfolio”. For those investors who already have all the money they need to comfortably retire on, safe-guarding their existing standard of living via the construction of a minimum-risk portfolio can often take precedence over growing the absolute size of one’s nest egg.
With that in mind, using our previously-described Total Risk portfolio framework, we set out to crawl through historical asset return data to determine the safest investment portfolio over the last 50 years. Now being the safest portfolio of yesterday certainly doesn’t guarantee it will be the safest portfolio of tomorrow, but short of a crystal ball, that’s all we really have. And besides, given that the last 50 years contained a decent mix of economic growth, recessions, low inflation, high inflation, financial panics, wars, and now pandemics, the last 50 years isn’t an unreasonable proxy for the diverse set of economic conditions we might well experience over the next 50 years. Will history repeat itself? Of course not. But more often than not, it does tend to rhyme.
Depicted in the chart below, then, is what we believe to be the safest possible portfolio currently available to investors.
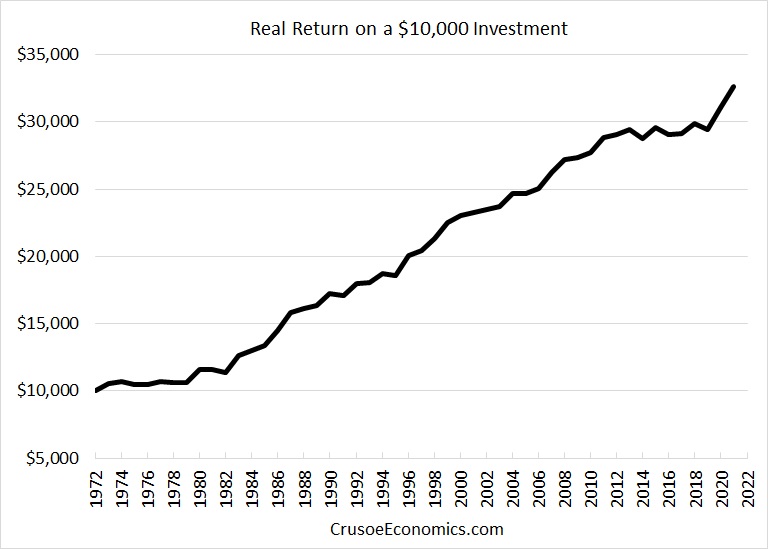
For additional context, here’s the same chart shown alongside a selection of common investable asset classes as well as the classic “60/40” portfolio. The chart shows all returns in inflation-adjusted terms and is depicted in log scale so that each increment on the y-axis represents a doubling of the investment. The reader can clearly see the incredibly smooth ride of our safe portfolio relative to other investments over the last 50 years.
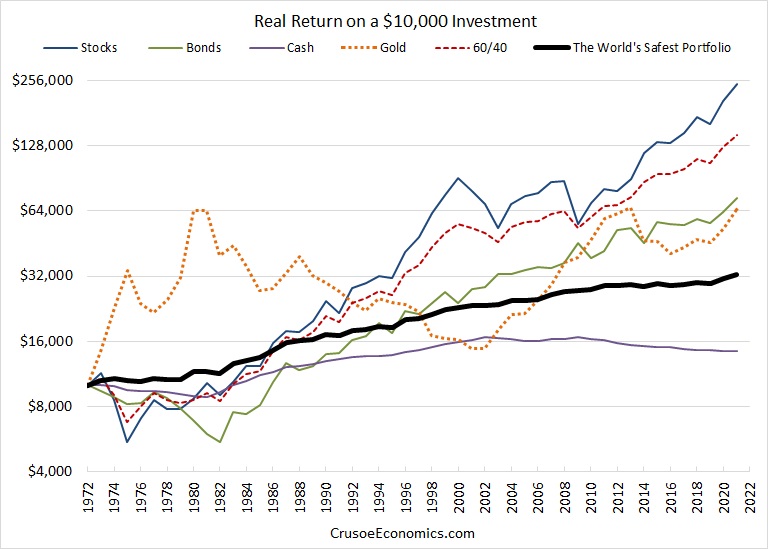
The important takeaway here is that our safe portfolio almost never loses money in real terms, and when it does lose money, the draw-downs are incredibly small and extremely fleeting. Of course, our safe portfolio also doesn’t have high inflation-adjusted returns, but that’s not the point. The point is that at any time since the early 70’s, if you wanted immediate access to your capital, you could get it relatively unencumbered with little risk of capital losses. So what exactly is the safest portfolio available to investors? What’s the asset allocation specifically? Before we can talk about asset allocation, a brief word about risk.
What’s Risky? What’s Not?
If you want to construct the safest possible investment portfolio, you first need to define what it means to be “safe”. In our view, increasing safety involves minimizing risk, so it makes sense to view the safest portfolio as one with the least amount of risk. This just begs the question, of course, of how exactly do you define risk? To be clear, we’ve never been comfortable using the common industry metric of standard deviation as a proxy for risk. The reason for this is because nobody in the real world outside the ivory towers of academia actually perceives risk as pure volatility. The average investor doesn’t care about volatility per se – what they care about are losses.
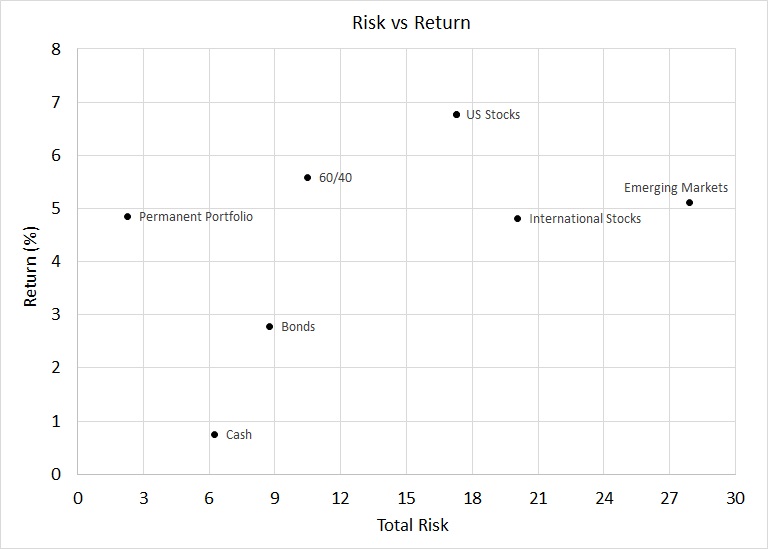
We’ve argued in the past that a much more accurate gauge of risk is a composite measure of three things that real-world investors actually care about – frequency of loss, magnitude of loss, and duration of loss. In other words, our preferred metric of risk seeks to boil down the different ways investors actually perceive real-world risk into a single number. This is what we refer to as Total Risk, which we can visually depict for a wide range of asset classes and portfolios using the classic risk-return chart below.
What’s often surprising to most readers is that the safer investment over the last 50 years hasn’t been cash – it’s been the Permanent Portfolio (consisting of 25% each of cash, bonds, stocks, and gold). While it’s true that cash tends to incur relatively small losses in any given year (due to inflation), these frequent small sequential losses tend to add up to very large losses over time. In many ways inflation is like putting a frog in warm water and bringing the water to a slow boil. The frog may not notice it at first, but the end result is always fatal. The same tends to go for inflation. The financial loss in any individual year due to inflation may certainly seem insignificant at first glance, but after a decade of small repetitive losses, the absolute drawdown on an investor’s portfolio can turn out to be incredibly destructive.
The Permanent Portfolio, on the other hand, may indeed be a bit more volatile than cash, but it loses money far less frequently and tends to recover those losses in short order. While cash may very well be the safest investment in the very short run, the Permanent Portfolio has a high degree of safety both in the short run and the long run. The following chart shows all inflation-adjusted drawdowns from the previous all-time highs for both cash and the Permanent Portfolio. Any year with a non-negative drawdown represents a new all-time high for the asset in question.
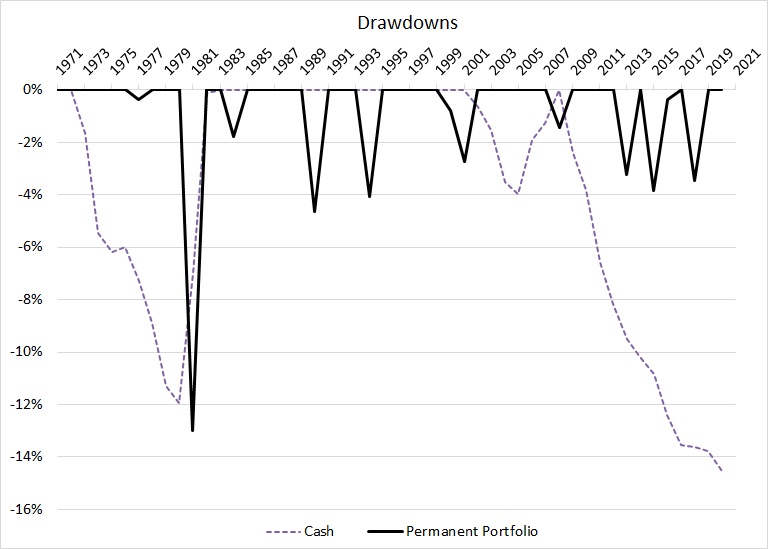
We can see from the chart above that cash is presently immersed in a 12 year drawdown which has so far managed to take it down 14.5% from its previous all-time high reached in 2008. So while cash offers a near-guarantee that investors will lose very little money tomorrow, the same thing cannot be said for several years down the line. Cash simply loses money far too frequently to classify it as a safe long term investment.
So does that mean we should simply crown the Permanent Portfolio as our minimum-risk portfolio? No, because while the Permanent Portfolio has indeed proven to be incredibly safe over the years, it nevertheless managed to incur a loss of approximately 13% in the early-1980’s. Even if those losses turned out to be fleeting and short-lived in hindsight, anyone looking for a bullet-proof investment to protect their hard-earned life savings would hardly consider a 13% single-year drawdown as “safe”.
The World’s Safest Portfolio
So if the Permanent Portfolio is simply too volatile in the short term to take the crown, and cash is too susceptible to inflation in the long run, what’s the alternative? Our idea was to create a blended asset allocation of both cash and the Permanent Portfolio to see if we could come up with something that could give us the best of both worlds – the ultimate min-drawdown portfolio. Cash is incredibly safe in the very short term, but its main failing has always been as an inadequate inflation hedge over the medium to long term. So perhaps blending cash with an incredibly stable investment that also outperformed inflation in the long run would give us a portfolio that incurred the shallowest, most infrequent, and shortest drawdowns yet. We performed this analysis by starting off with a 100% cash portfolio, and blending different amounts of the Permanent Portfolio in 10% increments. The results are shown in the chart below.
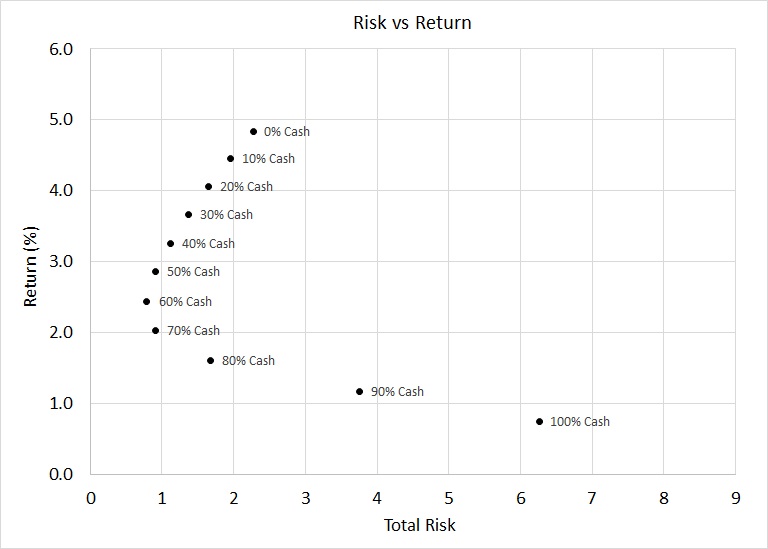
If we ignore returns and focus solely on risk, we can see that the safest portfolio in the chart above is the one that contains 60% cash and a 40% allocation to the Permanent Portfolio, with the Permanent Portfolio being an equal mix of gold, cash, stocks, and bonds. When you strip it down to its building blocks, then, the final asset allocation of our safe portfolio is 70% cash, 10% stocks, 10% bonds, and 10% gold – for a long term inflation-adjusted compound annual growth rate of 2.4%. Adding this portfolio to our previous risk-return chart we showed earlier allows us to compare this new portfolio to a variety of different investments.
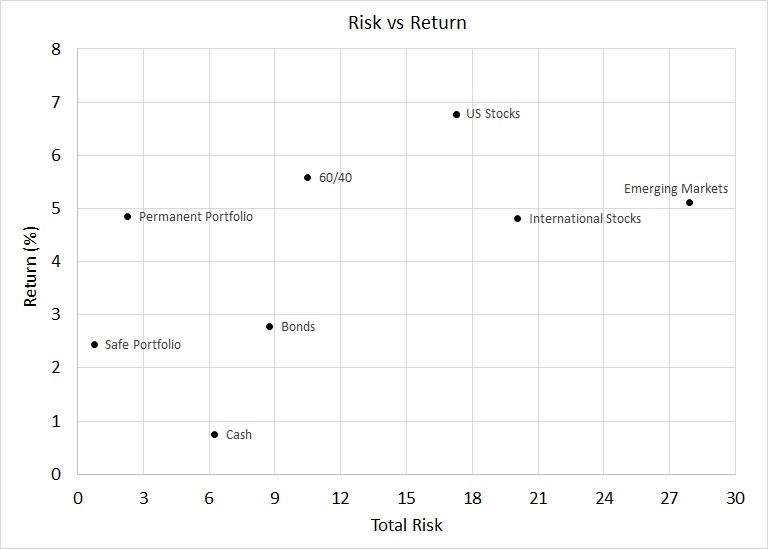
The verdict is pretty clear. The 70% cash/10% gold/10% stocks/10 bonds allocation is the least risky portfolio in the chart above. While we haven’t shown every possible asset allocation under the sun in order to keep the chart readable, we’ve also run the analysis for a wide assortment of popular statically allocated portfolios and have yet to encounter any real-world portfolio with a lower risk profile than our safe portfolio shown above. In terms of pure returns, it’s true that our safe portfolio returns a lot less than the Permanent Portfolio, but at the same time it provides investors with a much smoother ride in the process. To demonstrate, here we show the drawdowns for our safe portfolio overlaid with the drawdowns for both the Permanent Portfolio and cash.
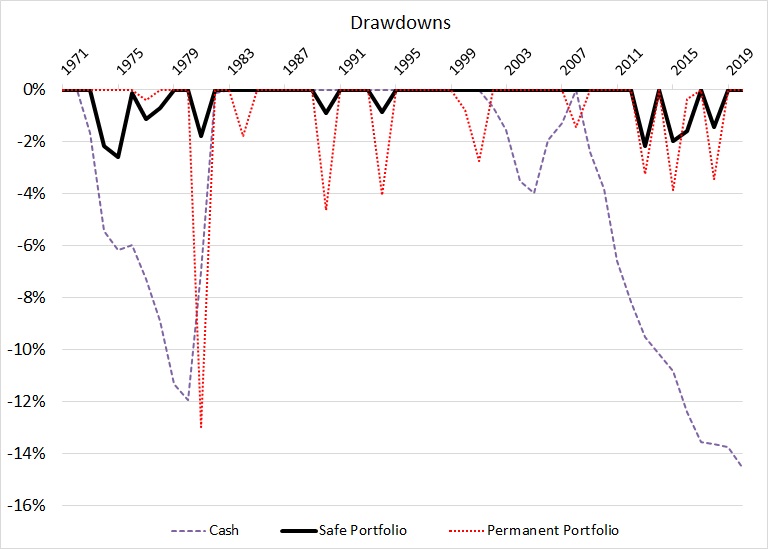
In inflation-adjusted terms, the largest loss incurred by our safe portfolio was a mere 2.6%, with the longest drawdown lasting just 2 years. Contrast this with losses for both cash and the Permanent Portfolio of 15% and 13% respectively, and we can see just how much more risky these so-called “safe” investments have been relative to our genuinely safe portfolio. What’s more, while our safe portfolio and the Permanent Portfolio each tended to recoup their losses reasonably quickly, cash today is still well below its all-time high reached over a decade ago. If a 12-year drawdown currently clocking in at -15% isn’t risky, then one has to ask themselves what is?
Conclusion
In many ways our safe portfolio is really the ultimate liquid asset. It offers investors the near-term optionality of liquidating their investments at any time with only minimal risk of significant inflation-adjusted losses. No other investment that we know of can boast that kind of safety over both the short term and long term. Cash certainly provides the best liquidity in the short term, but in the long run falls short due to the steady erosion of its purchasing power. On the other hand, virtually any other asset or investment that protects against long-run inflation also has the potential to incur punishing losses in the very short term.
Our safe portfolio truly offers the best of both worlds, offering minimal drawdowns over virtually any timeframe. The truth is that if you don’t really need to take risks with your money – if you already have all you need to meet your financial goals – you have the luxury of pursuing an investment strategy where return maximization takes a back-seat to risk mitigation. Sometimes maintaining one’s standard of living is more important than accepting unnecessary risks for the sake of growth. For investors who simply want to safeguard their financial well-being against various tail-risks such as stock market crashes, unexpected inflation, pandemics, or financial panics, there’s far worse things they could do with their money than investing it in what has historically been the world’s safest portfolio.