
Adherents of Austrian Business Cycle Theory are well aware that the increasingly violent and severe boom-bust cycles that regularly occur in today’s modern economy are in fact the consequence of dramatic swings in the money supply. Most mainstream analysts have little understanding of this relationship, as they continue to hold fast to the erroneously belief that the business cycle is in some manner the primary driver of the credit cycle when in fact it is the other way around. When record-low interest rates cause banks to extend credit and create money at an increasing rate, they provide a false air of prosperity while simultaneously causing a gross misallocation of capital which weakens the structure of production as resources are drawn away from legitimate industries towards those of the bubble economy.
Either through the extension of credit by commercial banks or through the direct asset purchases by Central Banks (such as QE), the expansion of the money supply sets in motion a domino of false price signals throughout the economy, leading to mal-investment and wasteful ventures by businesses that would otherwise never occur absent the preceding expansion of the money supply. If the money supply growth is suddenly then permitted to decline by a material amount, the mal-investment is over time exposed and businesses, now seeing the temporary and artificial demand they had previously enjoyed finally evaporate, are forced to reduce operations or go out of business altogether. This sets in motion the “bust” phase of the boom bust cycle during which resources are once again re-allocated in their proper proportions and a general and widespread economic recession ensues. For an easy-to-understand case study of this process and its resulting economic consequences, see Inflation, the Disease of Money.
In a previous article (see Follow the Money), a detailed explanation was provided of how changes to the money supply can reliably be tracked through an independently calculated metric called the True Money Supply (TMS). Government reported and commonly used metrics like M0, M1, and M2 are not only poor and improper definitions of money, but provide misleading signals regarding important turning points in the broad economy. Specifically, while traditional measurements like M2 sometimes fail to provide timely signals of market crashes and financial panics, the TMS has historically provided much more accurate and definitive warnings, predicting both the Dot-com crash of 2001 and the housing crisis of 2008.
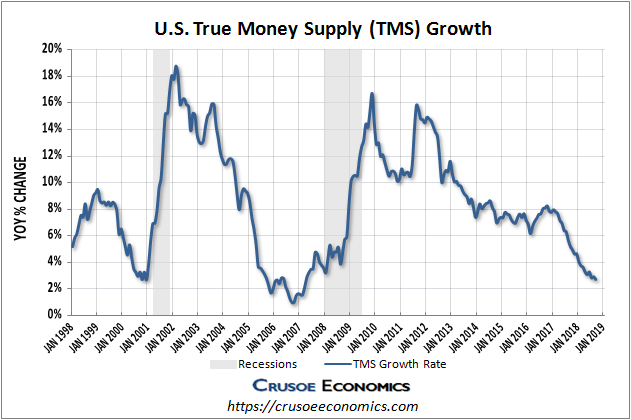
One of the main drawbacks of using TMS as a predictive leading indicator of the business cycle is that there has tended to be a considerable time-lag from when the growth of the money supply begins to slow to when the economy finally begins to show measurable signs of weakness. For example, the US TMS growth rate fell decisively below the 4% threshold typically associated with economic busts back in 2005, but the official start of the recession brought about by the housing crash didn’t formally begin to register until 2008, almost 2 and a half years later. There were of course significant signs of weakness before 2008, but the fact remains that as a market timing tool, the US TMS is a somewhat delayed indicator of global economic recessions.
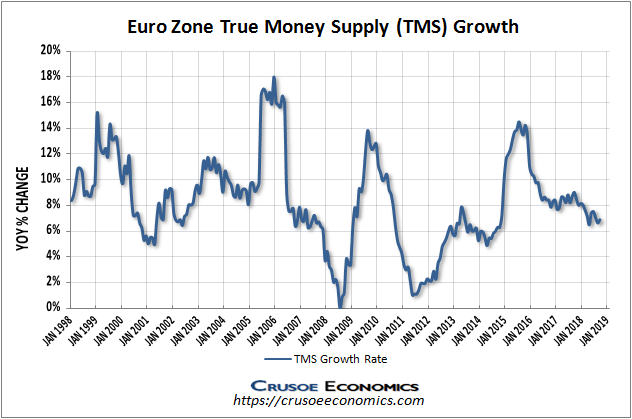
Steve Saville over at The Speculative Investor has done extensive analysis on the relationship between the money supply and global boom-bust cycles. He theorizes that the reason for the historical time lag between US TMS weakness and the subsequent 2008 recession was the dramatic expansion of the money supply in the Euro Zone over this same period. The Euro Zone, owing to its large contribution to the overall global economy, was effectively able to temporarily offset weakness in the US economy and postpone the start of the global economic bust precipitated by the bursting of the bubble in the US housing market. Only after the Euro Zone began to slow the growth rate of the money supply and the global TMS contracted by the required amount was the mal-investment finally exposed and signs of an economic bust finally become apparent for all to see.
As a result of this insight, Steve Saville now tracks a new metric he has termed “G2 TMS”, which is the combined money supply growth rate of both the US and Euro Zone. As the TMS of the two largest economic zones in the world, this indicator has proven significantly more reliable in determining global boom-bust cycles throughout history, with a TMS growth rate of anywhere below 5% seemingly a precursor to impending economic crisis. In the chart below, we show the combined US and Euro Zone TMS growth rate, computed independently from publicly available money supply data provided by the ECB and US Fed. We also show the TMS growth rate of both the US and Euro Zone independently for reference:
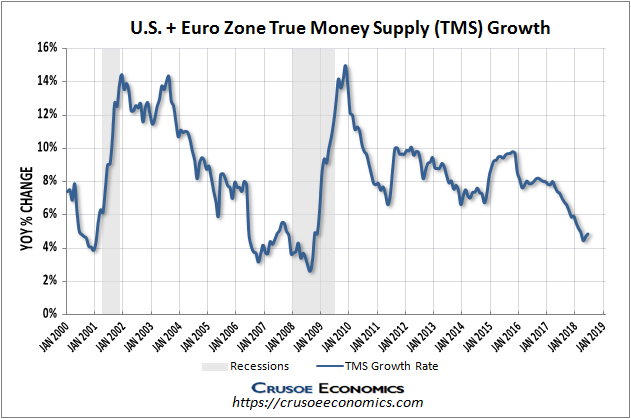
The above chart shows that combined US and Euro Zone TMS began to weaken more than a year prior the start of the 2008 recession, illustrating that while this metric is still a significant improvement over the US TMS indicator, there still exists a considerable time lag between money supply weakness and subsequent economic busts. But this is simply an example of the non-uniform nature of mal-investment. The cluster of errors that occur due to the misallocation of capital are not always immediately corrected when liquidity contracts since borrowers and businesses are often able to “extend and pretend” for prolonged periods before defaulting on loans or declaring bankruptcy.
To illustrate this delayed liquidation using a familiar and modern-day example, consider that a significant portion of bank mortgage loans are offered with fixed-rate payments locked-in over multi-year terms. Alternatively, many variable-rate mortgages are serviced through constant monthly payments that simply alter the proportion of each payment going towards principal versus interest when the mortgage rates rise or fall. In these scenarios, a rising rate environment and corresponding reduction in global liquidity may not adversely impact their ability to service mortgage payments for several years after the money supply weakness becomes apparent in the TMS indicators shown above. In other cases when banks call back on loans at a quicker pace or defaults become more readily realized, the mal-investment is revealed sooner and money supply weakness becomes a better real-time indicator of subsequent economic busts.
Given that the combined US and Euro Zone TMS growth has historically served as a superior metric in predicting boom-bust cycles in the global economy, we will be focusing on this measurement over the US TMS as our preferred leading indicator of economic bubbles and financial panics. Currently with both the US TMS and the combined US and Euro Zone TMS levels well within the threshold for signaling the next economic bust, investors should anticipate a 2008-style financial crisis within the next 12 to 18 months.