
When it comes to breaking from conventional wisdom, legendary investor Warren Buffett tends to hold a rather unorthodox view on the value of cash. Far from simply being a low-yielding asset with minimal volatility, he considers holding cash akin to owning a call option on every single asset class with no strike price or expiration date. This is a reflection of the fact that cash represents the ultimate form of optionality, providing its holders with the exclusive right to buy distressed assets on sale at any time and at any price. He considers the “option premium” paid on one’s cash holdings to be merely the opportunity cost of holding a low-returning asset like cash versus other higher returning alternatives like stocks or bonds.
Certainly, bonds or other low volatility assets that are inversely correlated to the broad market can often maintain their value when stocks crash, but this isn’t an immutable fact. There are many instances throughout history where both stocks and bonds have crashed in unison, illustrating the fact that bonds are far from the type of immediate liquidity that investors sometimes like to claim. Cash, on the other hand, is uniquely positioned to increase in relative purchasing power when risk assets fall, allowing one to scoop up these assets “on the cheap” at exactly the time when their expected future returns are the highest. No other asset bestows this type of privilege on investors, as all other assets are merely claims on an unknown quantity of future liquidity. Cash, by contrast, is liquidity in and of itself.
Readers will of course immediately point out that, due to inflation, cash hardly guarantees a constant purchasing power over time relative to all other assets. In other words, the fact that Warren Buffett believes that his call option has no “expiration date” would seem to be an error, since in the long run the value of cash is eventually eroded due to continuous inflation. All currencies eventually converge to zero, after all, and one can say with absolute certainty that in the long run Warren Buffett’s “call option” will ultimately expire worthless as well.
The challenge perpetually faced by investors, of course, is how to balance the two main types of risk within an investment portfolio. Namely, holding large quantities of cash protects one from short-term “permanent loss risk” and exposes one to “purchasing power loss risk”, while holding risk assets like stocks tends to protect one against inflation in the long run while exposing one to the potential for catastrophic losses in the short term. Nevertheless, for risk-adverse investors who aren’t inclined to speculate in risky assets, there is clearly a desire to hold significant risk-free liquidity, regardless of the fact that this liquidity may pay nothing over the long run. Sometimes it’s not what you make that’s important, but what you keep.
The Brave New World of Negative Interest Rates
Irrespective of the incessant claims of managed-money who constantly argue that investors need to be “in the market” at all times, there is a significant subset of the investing population who would choose to keep a sizable portion of their holdings in cash if they could mitigate against both these types of risks simultaneously. Seasoned investors will remember the days of the 1980s and 1990s when real interest rates were significantly positive, essentially providing investors with the best of both worlds – short term permanent loss protection while at the same time providing protection against inflation due to positive real interest rates.
Of course, those times are long gone, with the turn of the century ushering in a strange new era of negative real interest rates during which inflation has tended to persistently exceed short term interest rates. But exactly how “strange” is this new world? In the 1970s, after all, negative real interest rates were more or less the norm as double-digit inflation eroded the real value of cash. While short term interest rates did adjust upwards somewhat during the 70s to compensate savers for higher inflation, the inflation-adjusted value of cash still declined moderately in the United States, and much more so in other countries outside North America.
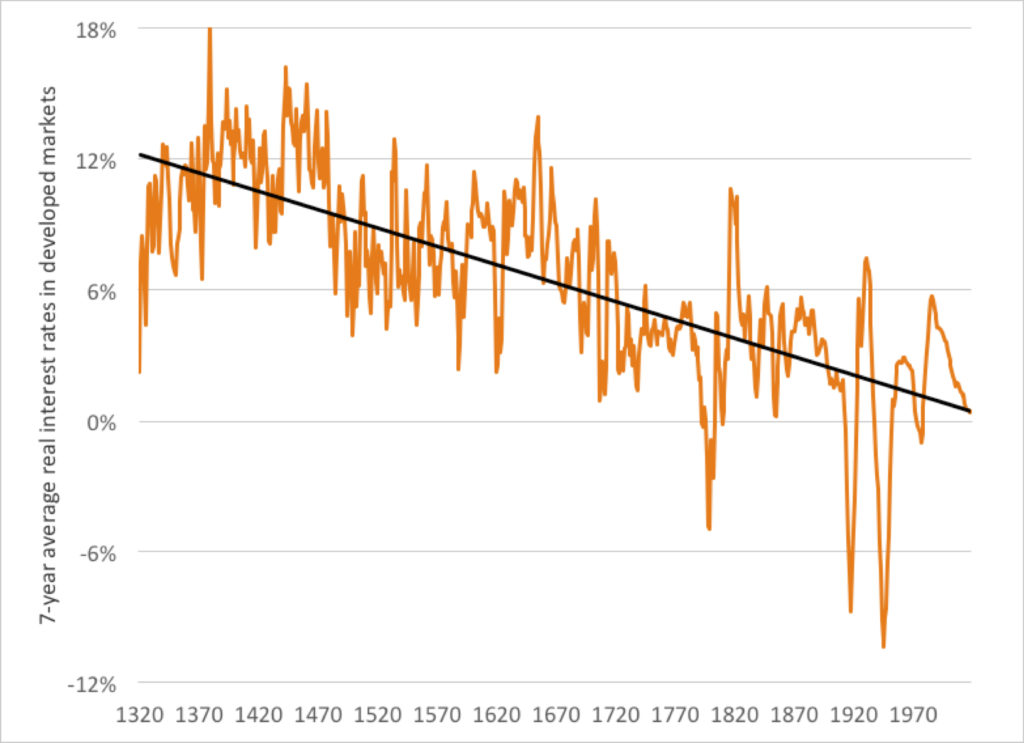
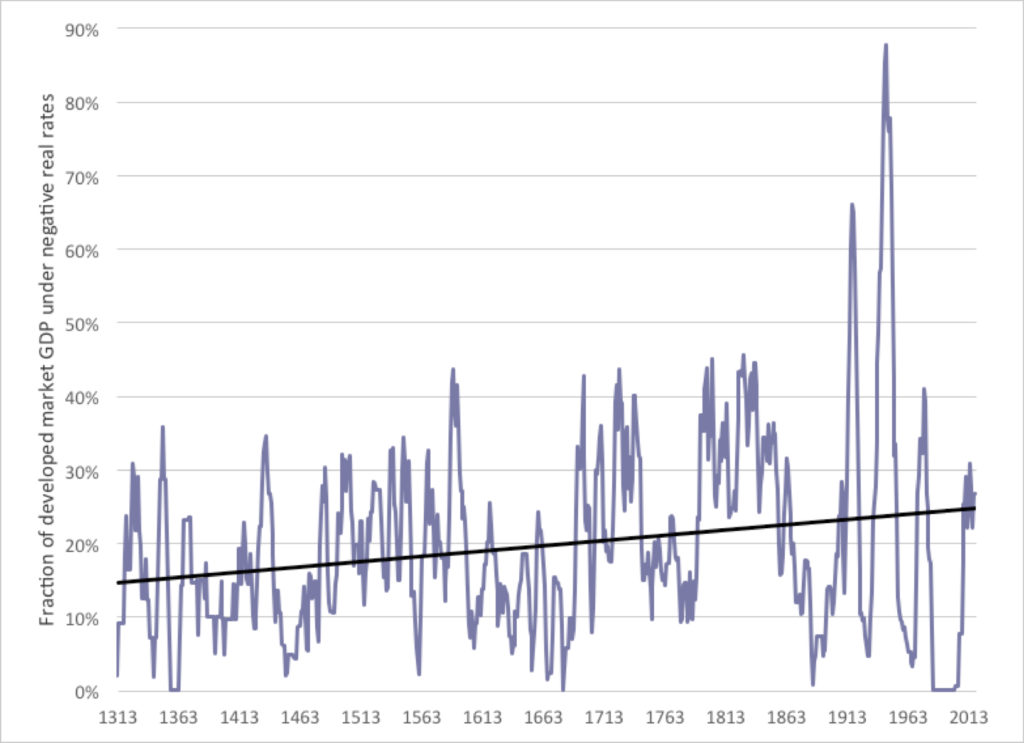
So maybe negative real interest rates aren’t such a strange thing after all. Somewhat surprisingly, in the near-50 years since 1970, the United States has actually spent more time in a negative real interest rate environment than it has outside of it. And over the very long term, the following two charts illustrate that real interest rates have actually been trending downwards for 600 years, with negative real rates being much more common in the developed world than most people generally believe1.
Longevity Insurance
Yet if purchasing power loss is something conservative investors need to increasingly worry about going forward, how exactly do they balance their need for risk-free liquidity with their desire to protect against the devaluation of their sacred capital? The traditional response from the investment industry, of course, is to buy stocks and other risk-assets which have tended to exhibit historical inflation-beating returns. But do conservative risk-fearing investors really need to blindly accept market risk as the de facto response to negative real interest rates? Maybe the starting point is to instead look at portfolio robustness from a more traditional risk-mitigation point of view. In other words, insurance.
The problem with holding a significant position in cash ultimately comes down to its finite life-span. Over short periods of time cash can be relatively stable, but over the long run all currencies eventually decay into worthlessness. Even over the intermediate term, such as 5 or 10 year periods, cash can lose a significant portion of its value during those times when central bankers feel the sudden urge to play fast and loose with the money supply.
What conservative investors are ultimately interested in, then, is really a form of longevity insurance for their cash. Such insurance should be cheap enough to hold during those times when the value of cash is relatively stable and money’s store-of-value characteristics aren’t being called into question by increasing inflation concerns. At the same time, in order to justify its cost, this “insurance” needs to provide a significant boost to investor returns during those periods where the purchasing power of cash is being increasingly eroded due to inflation.
In other words, the insurance needs to “pay out” during times when inflation overwhelms the nominal yields on cash. And just as with all insurance, holding this protection comes at a cost, which is ultimately just the drag on portfolio returns during those times when the insurance is simply sitting around dormant and unused. By embedding a form of longevity insurance into our cash holdings, we can create a form of blended “liquidity” that maintains most of the short-term stability of cash while also mitigating against the erosion of purchasing power due to inflation over time. This is the basis behind what I call “The Liquidity Portfolio”.
What is the Liquidity Portfolio?
The Liquidity Portfolio consists of only two assets: 85% cash and 15% gold, rebalanced annually. The large allocation towards cash reflects the design of the Liquidity Portfolio towards being “cash-like” in terms of its volatility and resilience against sudden draw-downs, while the allocation towards gold represents the insurance against those periods when the returns on cash are eroded through inflation. While gold can indeed be thought of as a form of insurance, it can also be thought of as just another form of money – a foreign currency if you will. As the oft-quoted investor Dylan Grice once said, gold is everyone’s foreign exchange, and if you think of gold as just another type of currency, it makes perfect sense to consider this portfolio as merely an investment allocation to “blended liquidity”.
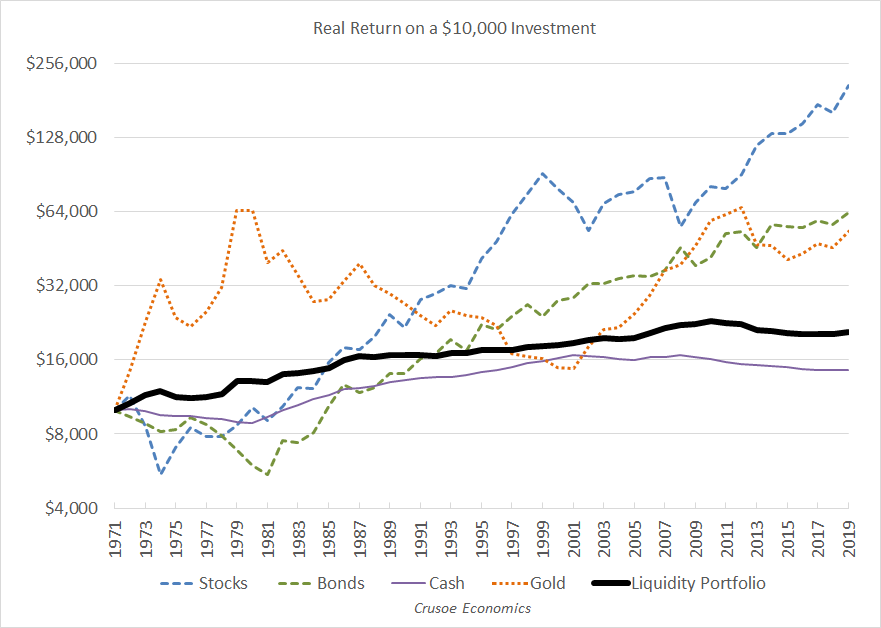
What exactly, then, does the Liquidity Portfolio look like? The following chart illustrates the real returns of the Liquidity Portfolio since 1970 for a US investor, compared with a portfolio of pure cash.
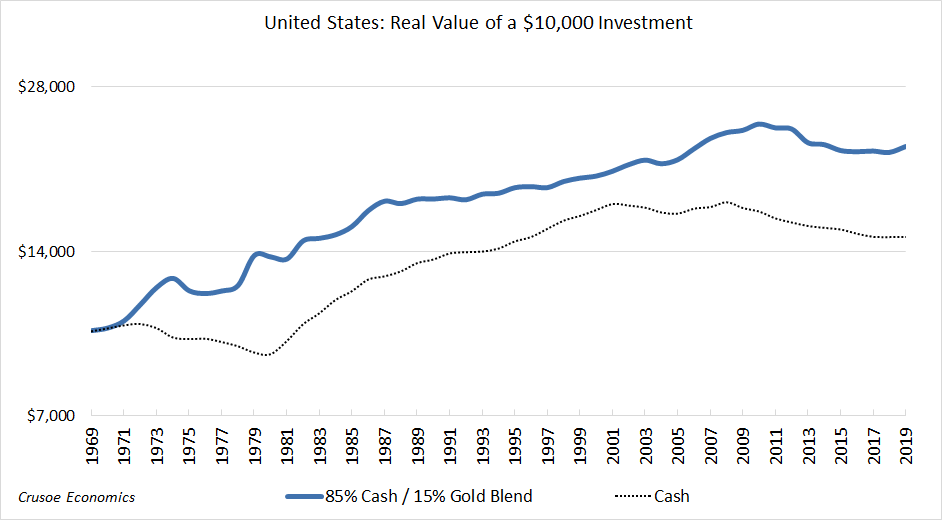
The 50-year time frame in the above chart encompasses both the inflationary period of the 1970s as well as the negative real interest rate environment from 2002 to present. While the real returns on a pure cash portfolio during these two periods were persistently negative, the Liquidity Portfolio managed to both preserve its purchasing power and actually thrive under both environments.
The 1980s and 1990s, on the other hand, were periods during which the real returns on cash turned significantly positive as relatively high nominal interest rates within a low inflation environment resulted in generous returns for risk-adverse investors. At the same time, both the 80s and 90s saw zero-yielding gold endure a protracted 20-year bear market, serving as a long-run drag on the returns of the Liquidity Portfolio relative to a 100% pure cash portfolio. The total real returns since 1970 are shown below.

We can see from the above table that the Liquidity Portfolio returned 1.56% per year for the entire 50-year period, versus 0.80% for the pure cash portfolio. Of course, the low real returns of the Liquidity Portfolio should hardly be concerning to investors, as its overall objective was to provide a stable portfolio with minimal drawdowns capable of preserving purchasing power during market downturns while also providing inflation beating returns over the long run. Looking back at the historical returns, the Liquidity Portfolio delivered on these objectives in spades, posting positive real returns during periods of both negative and positive real interest rates. In other words, the Liquidity Portfolio gave investors a relatively smooth ride through starkly different interest rate environments while still managing a total real return of 177% over the entire 50-year period.
Premiums and Payouts
The relative stability of the Liquidity Portfolio should come as no great surprise, of course, as the portfolio’s gold component was added to provide insurance against purchasing power loss by “paying out” during those times when the real returns on cash were especially poor. By measuring the excess returns of the Liquidity Portfolio over the returns of the pure cash portfolio, we can quantify the insurance payout received during the inflationary 1970s and the negative real interest rate environment from 2002-2019. By the same token, by comparing the extend to which the Liquidity Portfolio underperformed a pure cash portfolio during 1981-2001, we can get a sense of the insurance “premium” exacted by choosing to hold a zero-yielding yellow rock during a time when cash was delivering a 3% real yield with virtually no risk.
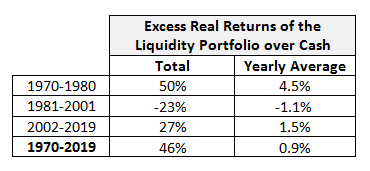
We can see from the above table that the Liquidity Portfolio underperformed cash by 23% from 1981-2001, amounting to an insurance premium of approximately 1.1% per year. However, the cost of holding this insurance ultimately proved fruitful, as investors were rewarded with returns of 4.5% per year above the rate of cash during the inflationary 1970s, and 1.5% per year above the rate of cash during the negative real interest rate environment of 2002-2019. For the entire period, the Liquidity Portfolio had a positive payout of 46% above a pure cash portfolio, illustrating the net benefit of insuring ones cash component against the long-run erosion of purchasing power due to inflation.
Portfolio Draw-downs
So it turns out that the Liquidity Portfolio performed more or less as we would have expected, with investment returns being dragged down during cash “bull markets” while being boosted by the gold component during cash “bear markets”. Over the entire 50-year period, the Liquidity Portfolio proved to be a relatively stable store of liquidity from which investors could either fund daily living expenses or purchase distressed assets on sale during periodic market corrections. While introducing a 15% allocation to gold may have indeed introduced slightly more volatility versus a pure cash portfolio, Liquidity Portfolio draw-downs in any given year were still rather tame.
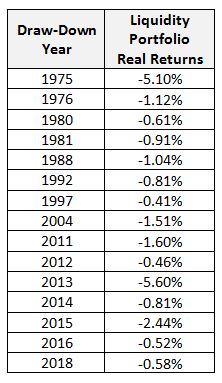
We can see that drawdowns during any given year were generally extremely low, with the largest annual draw-down being the -5.6% incurred during 2013 and more than half of the drawdowns clocking in at less than 1%. By contrast, a pure cash portfolio incurred a maximum annual real draw-down of -3.85%, illustrating that while the cash portfolio was indeed safer in the very short term, this slight reduction in volatility was hardly large enough to offset the inflation-fighting benefits bestowed upon us by the Liquidity Portfolio. Indeed, the graph below illustrates how the minimal drawdowns of both cash and the Liquidity Portfolio provided investors with the dry powder necessary to take advantage of periodic market corrections. Of course, only the Liquidity Portfolio managed to preserve investor purchasing power during the negative interest rate environments of 1970-1980 and 2002-2019.
The Case for Gold
Looking at the returns of gold and cash from the previous chart, we see that gold has historically tended to move higher during periods when real interest rates have been negative. More specifically, gold responds positively during periods when economic confidence is low and the population is increasingly looks to save, but is unwilling to save in increasingly devalued dollars. Using the stock market as a barometer for economic confidence, this explains why gold tends to move higher during periods when protracted equity bear markets also coincide with negative real interest rates.
Effectively, declining confidence in the economy prompts a certain segment of savers to move into gold precisely because they are unwilling to suffer real losses in dollar terms. This is why adding a blend of gold to one’s cash holdings has historically served as an excellent hedge during periods of declining purchasing power for cash. Gold tends to re-assert its status as the premier foreign exchange desired by investors when the value of more traditional alternative foreign currencies becomes suspect. Unlike paper currency, gold cannot be printed or have its value debased by central banks. Gold is simply a yellow rock with no counterparty risk that just sits there collecting dust. Gold is just gold.
With that in mind, readers will recall that the ultimate objective of the Liquidity Portfolio was to add a form of longevity insurance to its cash holdings, and no asset has a greater longevity profile than gold. After all, gold will be around tomorrow and it will be around in a thousand years. The same cannot be said about stocks, bonds, the dollar, or any other financial asset in existence today. Certainly we would expect that over the next 5 years the financial markets will remain intact, but can we really say with absolute certainty that the same will hold true for the next, say, 30 years? From that perspective, gold not only provides insurance against periodic episodes of negative real interest rates, it also performs double-duty as a form of disaster-hedge against unexpected tail-risk.
Constructing a Liquidity Portfolio
All of the above, of course, begs the question, why does the Liquidity Portfolio allocate only a 15% weighting towards gold, when a higher allocation would have significantly boosted returns during periods of negative interest rates? This is because the objective of the Liquidity Portfolio isn’t to deliver the maximum returns during episodes of negative real interest rates, but to provide enough of a boost to provide purchasing power protection while at the same time maintaining cash-like stability during market draw-downs. Add too much gold, and the cash-like stability of the Liquidity Portfolio disappears. Add too little, and the portfolio fails to sufficiently offset cash losses during periods of negative real interest rates.
Of course, the larger the allocation towards gold during periods of positive real interest rates, the higher the opportunity cost of not holding an interest-bearing asset like cash. In other words, at higher weightings of gold the insurance premium paid during the 1980s and 1990s to hedge against the possibility of negative rates would become prohibitive, dragging down overall returns to such a degree as to make the higher allocation to gold hardly worth the additional cost.
In designing the Liquidity Portfolio, the base case was to begin with an allocation of 50% gold and 50% cash, and adjust the gold component downwards until the appropriate blend was achieved. Once this blend was determined from the point of view of a US investors, the exercise was then expanded to other developed countries to verify that the 85/15 allocation of blended liquidity achieved the desired mix of stability and purchasing power protection globally as well. Countries included in this comparison consisted of Germany, the United Kingdom, Canada, Japan, and Australia.
The inflationary experience of the 1970s for many countries differed somewhat from the United States, dictating a somewhat higher allocation towards gold than would otherwise have been needed for a US investor. The United Kingdom, for example, suffered significantly higher inflation than the US throughout the 1970s, requiring a 15% gold allocation in order to mitigate the losses and break even after inflation.
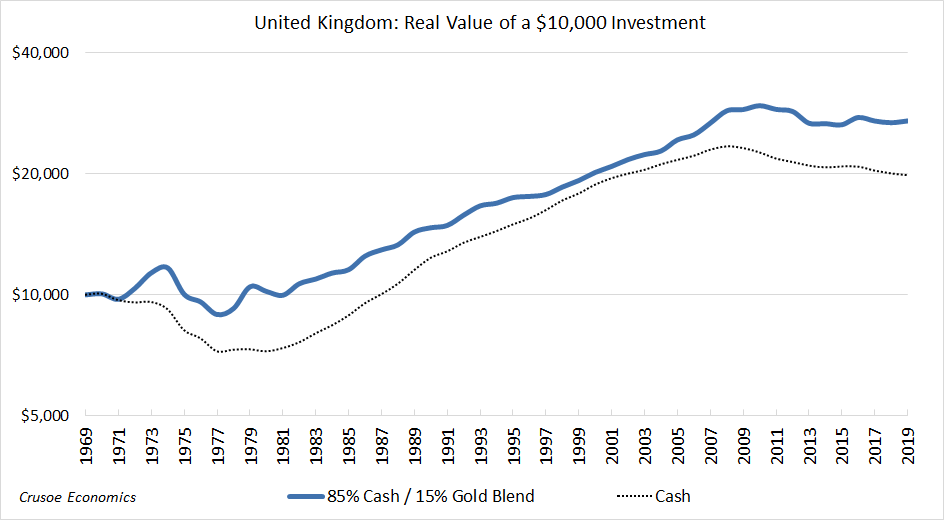
Of course, no weighting of blended liquidity provided the optimal conditions for all countries studied, but the 85/15 allocation met the spirit of the Liquidity Portfolio for all cases in that it managed to preserve purchasing power while minimizing portfolio draw-downs. The Liquidity Portfolio for a UK investor, for example, managed to end the 1970s at almost the exact value it started. While in 1977 it was almost 11% below the original $10,000 investment in real terms, this was still significantly better than the 27% real loss for a pure cash portfolio over the same time frame. Furthermore, where the Liquidity Portfolio managed to maintain its principal value throughout the 1970s, it took until 1987 for a cash investor to fully recover their principal investment once adjusted for inflation.
A New Type of Liquidity
While the Liquidity portfolio ultimately aims to preserve investor purchasing power while at the same time minimizing near-term draw-downs, the reality is that in today’s environment of negative interest rates, there really is no such thing as a risk-free return. Locking into a short-term insured time deposits like a GIC may give you a slight positive real rate of return, but doing so surrenders ones much needed liquidity during times when markets inevitably correct. Holding stocks and bonds also isn’t the answer, as the experience of the 1970s clearly illustrates the reality that both asset classes are more than capable of experiencing severe inflation-adjusted draw-downs in unison.
But it isn’t just investors seeking to purchase distressed assets that need near-term liquidity. Average people who simply wish to hold a rainy-day emergency fund for unexpected expenses are equally impacted. After all, people hold liquidity because life is uncertain. A job loss, reduced working hours, a pay cut, reduced benefits, large-scale medical expenses, and increased mortgage or insurance costs are all potential reasons people hold near-term liquidity. Most people choose to hold this liquidity in cash, but in an environment of negative real interest rates, holding cash simply becomes a losing proposition.
Yet the population at large hardly has a choice to instead invest their emergency liquidity in inflation-beating risk-assets like stocks rather than cash. The need for emergency liquidity doesn’t wait for markets to recover from near-term losses. When one needs instantaneous spending power, they sell what they can regardless of market conditions. Risk-adverse savers are therefore forced to simply hold liquidity in cash while accepting that this pool of money will simply be eroded over time. The erosion of purchasing power simply means that the population at large will be forced to save even more than they otherwise would have had the returns on cash been positive.
The Liquidity Portfolio is the answer as to how investors and savers alike can allocate their risk-free capital to maintain both near-term and long-term purchasing power. The structural diversification inherent in mixing both hard and fiat money makes the blended combination of cash and gold an extremely robust “all-weather” portfolio capable of maintaining the real value of money in both the short and long term. True, the Liquidity Portfolio doesn’t return much in the long run, but at least it returns its principal, which is more than can be said about cash during the 1970s, 2000s, and 2010s.
At the end of the day, the increasing propensity towards negative real interest rates makes it a foregone conclusion that Warren Buffett’s so-called “call option” will eventually expire worthless due to inflation. We don’t know when it will expire precisely, but with cash being devalued on a daily basis, the value of the option grows smaller by the day. So perhaps it’s the Liquidity Portfolio instead that truly serves as the call option that never expires, granting investors the right to buy regardless of circumstances and market conditions. It’s the option to hold on to your risk-free capital come hell or high-water, and not being strong-armed into accepting undue risk by the repressive policies of central bankers. Sometimes a return of your capital is more important than a return on your capital. For risk-adverse investors seeking some semblance of capital safety, that ought to be enough.